Field Notes
How to Build a Solar Operations Dashboard Owners Will Actually Use
Build a solar operations dashboard that helps U.S. installer owners see project load, permit risk, install readiness, PTO, invoices, and margin.

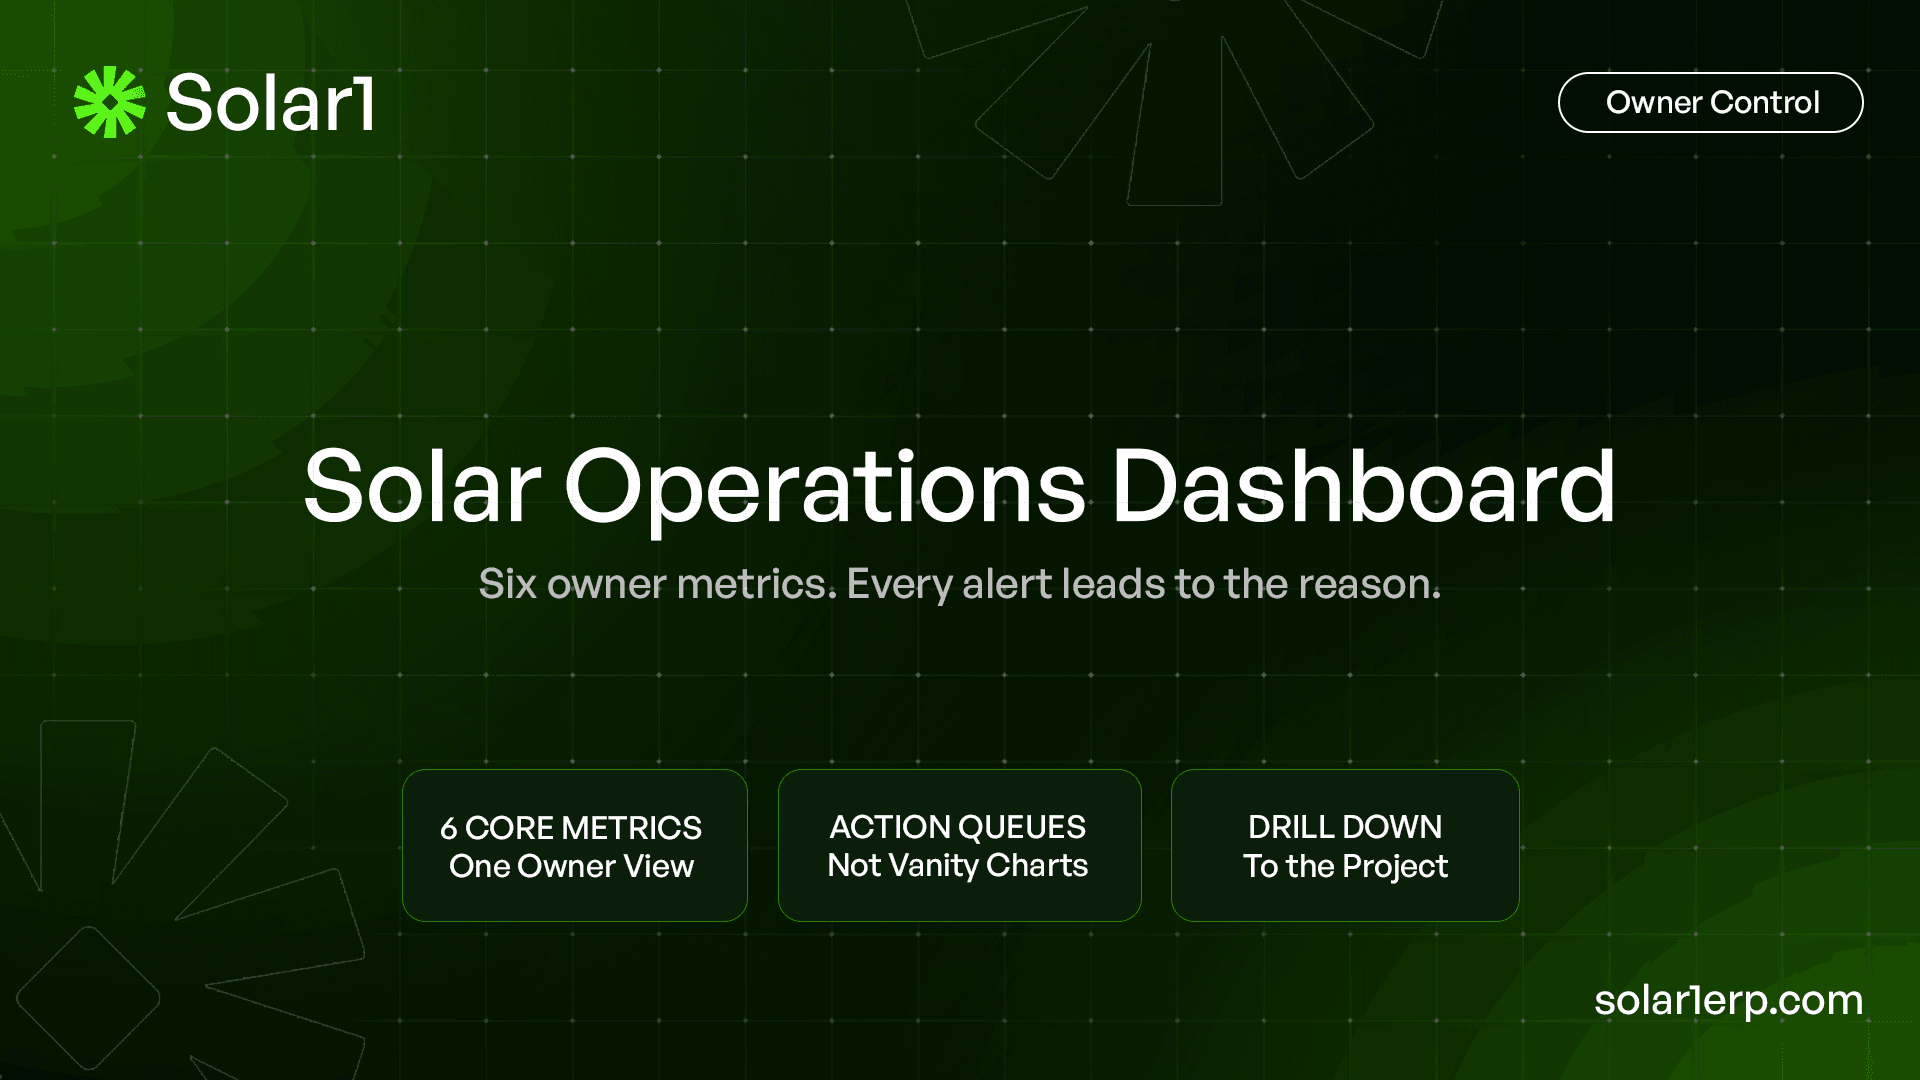
A solar operations dashboard should not try to summarize everything your company knows.
It should tell the owner what changed, what needs action, what money is waiting, where delivery capacity is tightening, and which projects deserve a closer look this week.
That is the difference between a reporting screen and a management tool. A chart can tell you that 14 permits are open. An owner dashboard should tell you which of those permits have crossed your escalation rule, whether the delay is internal or external, who owns the next move, and which installs or billing events are now exposed.
For U.S. solar installers, the best starting point is not more charts. It is a small set of decision cards backed by clear definitions, exception rules, and drill-downs to the projects creating the number.
What makes a solar operations dashboard useful to an owner?
A useful owner dashboard answers management questions before it displays activity. It should help leadership decide where to escalate, what can be scheduled, what cash event is waiting, where a project forecast changed, and whether the company has enough capacity for the work coming through the system.
That means the owner view should be different from a project manager's board, a permit coordinator's queue, or a crew schedule. Those operational screens may contain hundreds of tasks and records. The owner dashboard should compress them into a few business conditions that require attention.
Think of the dashboard as an exception router
An exception router does three things. It shows the condition, identifies the projects or transactions behind it, and routes the problem to the person or decision that can change the outcome. If a red card only tells the owner that something is bad, it is decoration.
The owner should be able to move from “five permits need attention” to the five projects, then see the AHJ, age, blocker, last action, internal owner, next action, and schedule or cash consequence. The dashboard summarizes. The underlying workflow explains.
Start with the decisions the owner makes every week
Before choosing a chart type, write down the questions leadership repeatedly asks. For a U.S. installer, those questions often cross project delivery, permitting, utility work, scheduling, finance, and margin.
A practical first version should help the owner answer six questions: How much work is active? Which permits need intervention? Which jobs are actually ready for a crew? Which installed projects are still waiting on PTO? Which billing events are ready but not issued? Which active projects have moved away from their expected margin?
These six questions come from the Solar1 content plan as a starter set, not as a universal industry standard. A high-volume residential installer, a commercial contractor, and a community-solar EPC may use different thresholds, extra cards, or different financial measures.
Use three dashboard layers
The first layer is the portfolio pulse: six or so cards the owner can understand in seconds. The second layer is the exception queue: the specific projects or financial events that require attention. The third layer is evidence: the permit record, material allocation, field completion, invoice condition, cost movement, or other source record behind the exception.
This structure prevents two common dashboard failures. One is a screen that is too shallow to explain anything. The other is a screen so detailed that the owner has effectively become the project coordinator.
| Owner card | What it should answer | Typical drill-down |
|---|---|---|
| Active projects | Where is operating load building? | Stage, age, branch, project type, delivery capacity |
| Stuck permits | Which permit items need action or escalation? | AHJ, reason, age, internal/external wait, owner |
| Ready to install | Which jobs can safely take a crew slot? | Readiness conditions, material allocation, site, crew |
| Pending PTO | Which physically completed jobs remain commercially open? | Utility, age, next action, customer or billing dependency |
| Delayed invoices | Which verified billing events have not become invoices? | Milestone, amount, missing approval or evidence, owner |
| Margin variance | Which active jobs changed economically? | Baseline, current forecast, cause, committed cost, change |
1. Active projects should show load, not just a big number
“42 active projects” is context, not a decision. The useful question is whether that portfolio is moving through the company at a rate the team can support. Break the total by meaningful operating dimensions such as stage, age, branch, project type, or delivery window.
A growing permit-stage count may mean sales and survey output is arriving faster than permitting can absorb it. A large install-ready queue with little crew capacity can mean the bottleneck has moved downstream. A falling active-project count can be healthy if closeout is strong, or concerning if new signed work is weak. The card needs context.
Do not duplicate the project status board here. The owner does not need every green, yellow, and red job on the first screen. Use the active-project card to understand portfolio load, then drill into project health only when the pattern deserves attention.
2. Stuck permits should separate internal delay from AHJ wait
For U.S. installers, a permit card needs more meaning than “open permits.” Local permitting and inspection requirements vary, and the U.S. Department of Energy notes that administrative errors and backlogs can delay rooftop-solar projects. That makes aging and ownership especially important.
The owner view should distinguish an application that is legitimately waiting on an AHJ from a correction the AHJ already returned but the installer has not resubmitted. Both may be 12 days old. One is external waiting. The other is internal waiting. Leadership should not treat them the same.
A strong stuck-permit card shows the number crossing the company's escalation rule, the oldest item, the split between internal and external wait, and the most common blocker reason. The drill-down should expose the actual projects and next actions.
Structured information matters more than another red badge
The 2026 SolarAPP+ performance review is a useful U.S. example of what structured inputs and review logic can change. In 2024, 861 installers submitted 37,393 permits through SolarAPP+, and a typical participating project was permitted and inspected 12 business days sooner than projects using traditional processes.
Those are SolarAPP+ results, not Solar1 results, and an owner dashboard cannot reproduce them by itself. The lesson for dashboard design is narrower: a management number is useful only when the underlying workflow has defined states, complete inputs, and traceable actions.
3. Ready-to-install should mean the job can really take a crew slot
An install calendar can be full while the company still lacks enough truly ready work. A job should appear in the ready-to-install card only after the company's own readiness conditions are satisfied.
Those conditions may include current approved plans, permit status, required customer or site actions, the correct material allocated, necessary subcontractor work, an appropriate crew, and any project-specific dependency the company requires before dispatch. The exact gate will vary by installer and project type.
The card should answer two owner questions: how many jobs are genuinely schedulable, and what is preventing the near-ready jobs from joining that queue? That second answer is useful for capacity planning because the company may be short on crews, or it may simply be short on projects that have cleared their prerequisites.
4. Pending PTO should expose aging after physical work is done
A project can look almost finished after installation while still carrying utility, inspection, meter, documentation, customer, billing, or closeout dependencies. That is why pending PTO deserves its own owner-level view rather than disappearing inside a generic “complete” stage.
The useful card is not just “18 pending PTO.” It shows age bands, utility or service territory where useful, the next known action, internal versus external wait, and which projects have a customer or financial dependency tied to the remaining work.
Avoid guessing at utility completion dates to make the dashboard look precise. When the date is genuinely uncertain, show the known state, last action, follow-up owner, and next review point. A truthful uncertainty is more useful than a confident fictional date.
5. Delayed invoices should show value waiting on an operational event
The owner dashboard should connect project progress to finance without pretending that every operational milestone automatically creates an invoice. Contracts and internal approval rules differ. What the dashboard can show is which required conditions have been satisfied and which invoice-ready items have not yet been issued.
A useful card can show invoice-ready value waiting to be issued, number of affected projects, age of the oldest item, and the most common reason for delay. The drill-down should answer whether finance is waiting on evidence, an approval, a customer condition, a corrected project state, or simply the next internal action.
Do not call the full value “lost revenue.” An invoice delayed by three days is primarily a timing and working-capital issue unless the company later fails to collect or must issue a credit. Precision makes the dashboard more credible.
6. Margin variance should show where the forecast changed
Margin belongs on the owner dashboard because operational decisions can change project economics before closeout. But the dashboard should not repeat the entire job-costing model.
Use the card to surface active projects whose current forecast has moved beyond the company's review threshold compared with the approved baseline. Then let the owner drill into the reason: material substitution, committed purchase cost, extra labor, repeat visit, unpriced change, schedule cost, or another recorded cause.
A percentage without a reason is not enough. If the owner can see that margin moved from the baseline but cannot identify the event that changed it, the chart is reporting a symptom rather than supporting a decision.
Give every KPI a metric contract
Dashboard arguments usually start with definitions. Operations counts a project as active after contract signing. Finance counts it after deposit. One manager removes cancelled jobs immediately. Another keeps them until the end of the month. The chart can be technically correct and still create a management argument every Monday.
Solve that with a metric contract. For every owner KPI, write down exactly what it means, where the data comes from, when it changes, what it excludes, who owns the definition, and what decision the metric is supposed to support.
| Metric contract field | Question to answer | Example for stuck permits |
|---|---|---|
| Definition | What exactly is being counted? | Permit item crossing the company's escalation rule |
| Source record | Which operational record creates the number? | Permit workflow record |
| Refresh rule | What event changes the metric? | Submission, response, correction, resubmission, approval |
| Exclusions | What should not appear? | Closed, cancelled, or non-actionable items by company rule |
| Owner | Who maintains the definition? | Operations or permitting process owner |
| Decision | What should leadership do when it changes? | Escalate, reassign, remove internal blocker, or adjust plan |
This does not mean the CEO should maintain a data dictionary. The business only needs enough definition that two competent managers looking at the same card reach the same conclusion about what it means.
Make every alert ask for a decision
Red, amber, and green can be useful, but color should represent a rule rather than emotion. An alert should fire because a defined condition changed: an internal correction exceeded the company's target, a scheduled job lost readiness, an invoice-ready milestone aged past a finance rule, or a forecast margin crossed a review threshold.
Do not copy another installer's thresholds. A residential business with standardized work and a commercial EPC with long engineering and utility cycles may need very different aging rules. Start from your own normal cycle time, customer commitments, contract terms, and management tolerance.
Then attach a decision type to the alert. Escalate external follow-up. Reassign internal work. Approve a substitution. Move a crew. Hold a schedule. Release an invoice. Review a margin change. A red card with no possible action becomes background noise quickly.
Build drill-downs around queues, not prettier charts
The owner should be able to click a metric and get an actionable queue. If the card says six invoices are delayed, the next screen should show the six projects, amount, milestone, invoice-ready date, missing condition, owner, and next action. It should not open another pie chart.
The same pattern works for permits, PTO, readiness, and margin. Each summary card should lead to the records responsible for the number. That traceability is what lets leadership challenge a metric, assign work, and verify that the condition actually changed.
The U.S. Department of Energy includes permitting, interconnection, supply-chain and inventory control, administrative work, and operating overhead within solar soft costs. A dashboard does not remove those costs on its own. It can help management see where controllable friction is accumulating before it becomes another week of delay.
How should team workload appear without turning into micromanagement?
Owners need capacity visibility, but raw task counts are usually a poor proxy for productivity. One permit coordinator may own 35 simple applications while another owns 12 correction-heavy commercial projects. Counting tasks can make the wrong person look overloaded or underused.
A better workload view focuses on operating demand: active items by role, aged exceptions, due work, near-term install demand, projects waiting on a specific function, and work that has no accountable owner. The purpose is to identify where capacity is constraining flow, not to rank employees by clicks.
For example, if the dashboard shows a growing design queue while procurement and field capacity remain available, leadership can investigate design inputs, staffing, or process quality. If the permit queue is growing because most jobs are externally waiting, hiring another permit coordinator may not solve the problem.
What should not be on the owner's first screen?
The owner dashboard should not become the graveyard for every metric the software can calculate. Keep information off the first screen when it does not change a decision.
That usually means avoiding raw task-completion totals, total documents uploaded, messages sent, lifetime installed megawatts without operating context, every overdue task in the company, and decorative trend charts that have no threshold or owner. Those numbers may belong in other reports, but they do not automatically deserve executive attention.
Do not mix asset monitoring with business operations
An owner may also need fleet, service, installed-asset, or production-monitoring views depending on the business. Those are valid dashboards, but they answer different questions. Do not crowd real-time system production, sales pipeline charts, permit exceptions, payroll metrics, and invoice queues into one screen just because the platform can display them.
A useful executive system can have several role- or purpose-specific dashboards. The weekly solar operations dashboard should stay focused on delivery decisions and their immediate financial consequences.
How often should an owner dashboard be reviewed?
Use a weekly owner review for the full portfolio, but do not force critical exceptions to wait seven days. A permit correction that invalidates Tuesday's install, a lost readiness condition, or a major margin change should surface when it happens according to the company's alert rules.
The weekly dashboard is therefore a control point, not the only time the company manages work. It helps leadership compare the portfolio, identify repeated exception types, resolve cross-functional decisions, and confirm that the business is not accumulating hidden work.
Monthly and quarterly views can add trend analysis such as permit-aging patterns, readiness conversion, recurring margin causes, billing lag, or capacity changes. Keep those trend reports separate from the weekly exception screen so historical analysis does not bury today's decisions.
Seven questions to test whether owners will actually use the dashboard
Before adding another widget, give the dashboard a practical usability test.
Can the owner see what needs action this week? Can they see what changed since the last review? Can internal delay be separated from external waiting? Can invoice-ready or delayed financial events be identified? Can margin changes be traced to a recorded cause? Can a capacity constraint be distinguished from a workflow problem? Can every important number be opened to the underlying records?
If the answer to several of those questions is no, adding more KPIs will not fix the dashboard. The problem is usually the definition, source data, exception rule, or drill-down behind the card.
How is Solar1 being designed around owner-level control?
Solar1 is being built as a complete solar-specific ERP for installers and EPC companies. Dashboards are one management layer inside a broader operating system that connects customer and sold-scope records with projects, design workflow, permitting, interconnection, procurement, inventory, field activity, finance, workforce, service, and reporting.
The product direction is to let an owner see exceptions from the records that create them. A permit alert should come from permit work. Ready-to-install should come from readiness conditions. Invoice-ready value should come from verified project and finance rules. Margin variance should come from current project cost and forecast records.
That is more important than having a large chart library. The owner should be able to open a dashboard condition and reach the exact project, owner, document, material issue, milestone, or financial event behind it.
Solar1 is still under development, so this describes the operating model the product is being designed around. It does not mean every dashboard, alert, metric, or drill-down described here is currently production-ready.
Build version one around action, then remove what nobody uses
Your first solar operations dashboard does not need 30 metrics. Start with the six cards in this guide, define the metric contract behind each one, and use your own company thresholds.
Run the dashboard through a difficult week. Use real examples: an AHJ correction, a material substitution, a crew slot with no ready job, a delayed PTO, a completed milestone waiting on finance, and a project whose forecast margin changed. Check whether each event becomes visible without leadership asking someone to rebuild the story.
Then remove cards that nobody acts on. Add a metric only when there is a recurring management decision the existing view cannot support. A dashboard earns its space by reducing uncertainty, not by proving how much data the company collects.
Use the Owner Dashboard Template to define your six cards, metric contracts, alert rules, and drill-down fields before building the final screen. The goal is simple: when the owner opens the dashboard, the next question should already be waiting with the answer behind it.
Steps
- List the owner's weekly decisions
Write the recurring questions leadership needs answered about project load, permits, install readiness, PTO, billing, margin, and capacity before choosing charts.
- Choose a small starter set of cards
Begin with the six decision cards that matter most to your operation instead of trying to place every available KPI on one screen.
- Write a metric contract for every card
Define what the metric counts, its source record, refresh event, exclusions, owner, and the decision it should support.
- Set company-specific exception rules
Define when an item becomes actionable using your own cycle times, commitments, project types, and management tolerance rather than borrowed benchmarks.
- Build an exception queue behind each metric
Make every card open to the exact projects, owners, ages, causes, financial values, and next actions creating the number.
- Add evidence drill-downs
Let managers trace an exception to the permit record, readiness condition, field event, invoice condition, cost movement, or other source record.
- Test the dashboard with a difficult week
Run real exception scenarios through the screen and confirm that leadership can understand what changed and what decision is needed without rebuilding the story manually.
- Remove metrics that do not change decisions
After several review cycles, retire cards nobody acts on and add new ones only when a recurring management question is not already answered.
Frequently asked questions
What should a solar operations dashboard show?
A practical owner dashboard should show a small set of decision-focused conditions such as active project load, stuck permits, install-ready jobs, pending PTO, invoice-ready items that are delayed, and material margin variance. Each summary should drill into the projects or transactions creating the number.
What are the best KPIs for a solar company owner?
There is no universal best KPI set for every installer. Start with metrics tied to recurring owner decisions around delivery load, permit risk, install readiness, PTO, billing, margin, and capacity, then define thresholds using your own project types, cycle times, contracts, and operating model.
How is an owner dashboard different from a solar project dashboard?
A project dashboard helps teams manage individual jobs, stages, blockers, tasks, documents, and next actions. An owner dashboard compresses those records into portfolio-level exceptions, capacity signals, cash events, and margin conditions that require leadership attention.
How often should solar owners review their operations dashboard?
A full portfolio review can work well on a weekly cadence, while critical exceptions should surface when they cross the company's alert rules. Monthly or quarterly views are better for trend analysis rather than day-to-day exception management.
How do you keep a solar dashboard from becoming inaccurate?
Give each KPI a written definition, source record, refresh rule, exclusions, owner, and intended decision. Every important number should also drill into the underlying records so managers can verify why it changed.
Should a solar operations dashboard include financial data?
Yes, when the financial condition is affected by project operations. Useful examples include invoice-ready value waiting to be issued and active projects whose forecast margin moved beyond a company review threshold, while full accounting detail can remain in the finance workflow.